An introduction to React Dev Tools
Are you finding it hard to debug your React apps? Here's a great introduction to the React DevTools, and what they can do for you.
We’ve all been there. There’s something that just doesn’t work like expected in your app, and you’re out of ideas on where the bug is. You’ve sprinkled console logs in every conceivable corner, and you’re still not sure why things aren’t showing up as they should. What’s left to try?
This article will show you when and how they’ll come in handy, and show you how to get the most out of your new favorite tool!
Why would you need this?
Before we dig into all of the features, it’s pertinent to discuss in what situations the React Dev Tools will come in handy. Here are a few off the top of my mind:
Debugging a misbehaving component
Sometimes, like in the story from our intro, you’re stuck with a component that just doesn’t do what it’s supposed to. It doesn’t show the data correctly, even though you’re completely sure everything is wired up as it should be.
The React Dev Tools lets you inspect any component’s props, state and hooks in a way that makes any mistakes painfully obvious. This way, you can see what’s the current situation, not what you’re assuming it to be.
Exploring different component states
Sometimes, there isn’t anything wrong with your components at all. But what happens when they suspend? What if you pass a different set of props, or modify that particular piece of state to cover a nasty edge case?
The React Dev Tools lets you modify all props and state to your liking, without discarding other state in your application. This makes it great for exploring edge cases, as well as speeding up your development feedback cycle.
Profiling performance bugs
React apps mostly perform really well without any performance optimizations. This is due to countless hours of engineering that lets you slip into that sweet pit of success, getting performant apps without any effort on your part!
With that being said, things can slow down once we start dealing with large data sets or complex UIs. And when that happens, the React Dev Tools is really indispensable. With it, you can trace all renders down to what caused them, and how long each one took!
Being curious
Finally, the React Dev Tools are really fun to use on sites you often use, like Twitter or Facebook itself. You can dive into their component trees, see how they name their state hooks and a ton of other fun stuff. Being curious is a great way to both learn and to get inspired.
How to get started
To install the React Dev Tools, you install the version for the browser you use (here’s Chrome, Firefox and Chromium Edge). There’s also a standalone version you can use when debugging Safari, other unsupported browsers or even React Native, which you can get from NPM.
Once you’ve installed the extension, pop open your developer tools and discover two new tabs marked with the ⚛️ emoji - Components and Profiler

Next, let’s look into what each of those tabs do!
The ⚛️ Components tab
As we mentioned initially, React is based on a component-centric model. This means there’s a root component rendering child components that render yet other components under them. Visualizing this isn’t easy, but the Components tab takes a great stab at it!
By default, the Components tab shows an overview over all the different components in your component tree. A typical view will look something like this:
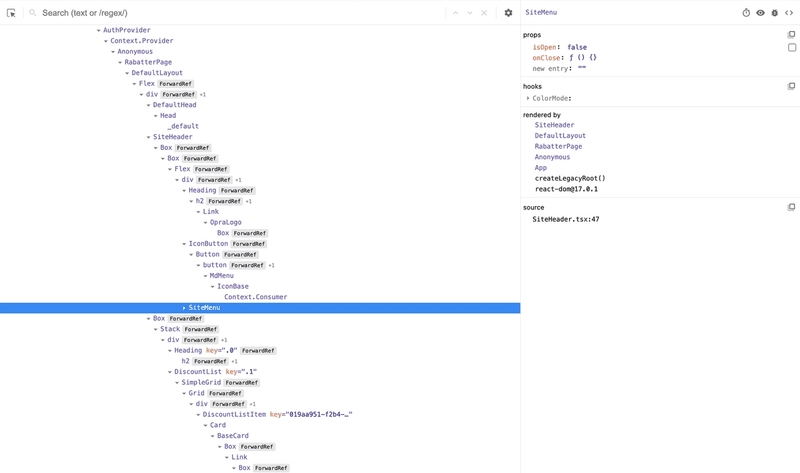
The main area to the left is the component tree. You can click to inspect each one, or collapse them if they’re not what you’re looking for right now.
The area to the right is the panel where all the props, state and hooks are shown, in addition to a (clickable) list of what component(s) were responsible for rendering it.
In the very top right corner, you see four icons.
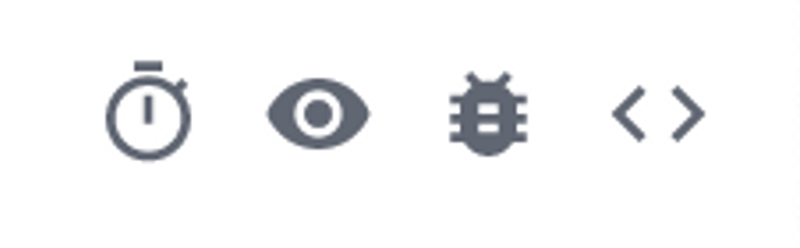
These four icons let you “suspend” the component, jump to the matching DOM node in the DOM inspector, log out all component data to the console for further investigations, and view the source code, respectively.
At the top left, you’ll discover a search field, which will be your best friend while navigating massive component hierarchies.

Once you’ve made yourself familiar with the interface, your best bet is just to click around and get a feel of how things work. Remember - all changes are reset on a refresh of the page, so don’t hold back on your experimentation!
The ⚛️ Profiler tab
If you’ve ever experienced performance issues in React, you know they’re pretty hard to track down. Well - at least until you discover the wonderful React Dev Tools Profiler tab!
With this tool in your belt, tracking down expensive renders or out-of-control re-renders is as easy as pushing a button. It lets you visualize every render, re-render and figure out what caused it.
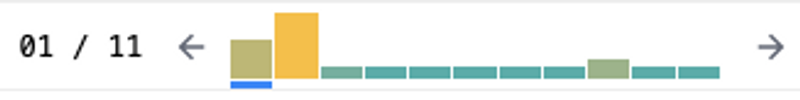
This is how a super simple profile looks like:
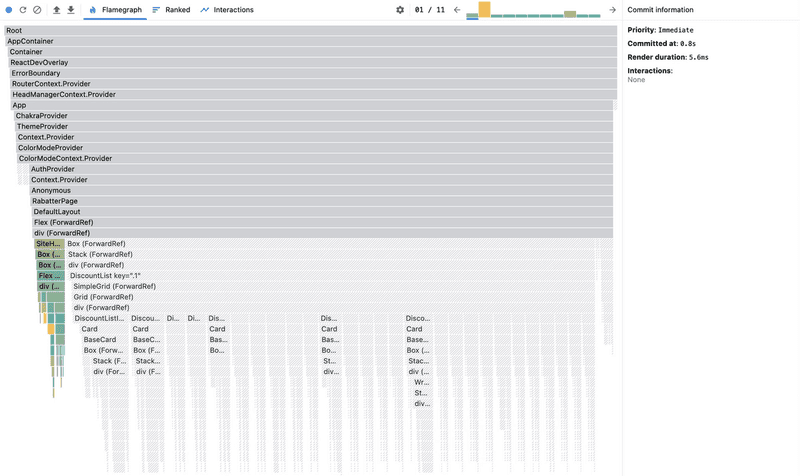
The area to the left shows a flame graph of all components in the application, and how much time they spend rendering. You can click into each one of those to zoom in and figure out why it happened:
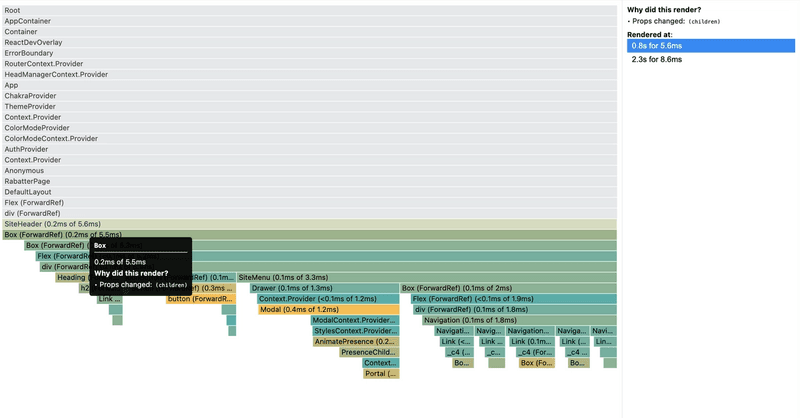
The Profiler tool lets you go through each render through this nifty little visualization. The bigger the bar, the longer the re-render took.
If you want to dive deeper into the React Profiler and what you can do with it, I suggest you read this wonderful deep dive by Ovie Okeh.
Summary
Exploring and learning the React Dev Tools will make you a much better developer than you are today. You can explore the different states of your application without touching the code, you can find and squash bugs in record time, and there’s really no reason why you can’t fine tune the performance a bit, too.