5 things you didn't know about React DevTools
React DevTools is becoming more powerful by the day. Let's look at some of the features you might not have tried yet!
If you’re into React development, chances are you’ve tried the official React DevTools. This browser extension lets you debug your components, and is available for Chrome, Firefox and even as a standalone application for Safari and React Native debugging.
The React DevTools is under active development, and new features are added all of the time. This article will show you five of those features that you might not have tried out yet, or that you simply didn’t know existed! Finally, we’ll look at what the future of React DevTools will bring.
Debug performance with the profiler
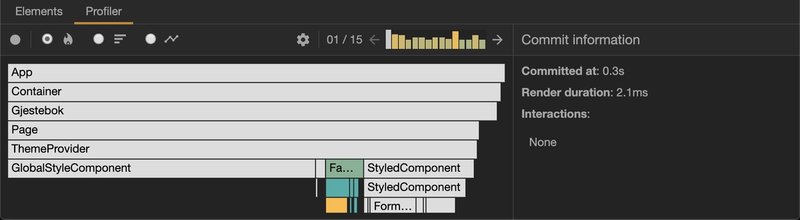
In September of 2018, the React team introduced an incredibly powerful feature for debugging performance related issues: the Profiler. When used with React 16.5 or later, the React DevTools provides you with a profiling feature, which shows you a summary of how your application re-renders.
Just like the regular JavaScript profiler found in your dev tools of choice, you’ll have to “record” a set of interactions. Once you’ve done that, you’ll see a visualization of each re-render your application goes through, with accurate timing information and color-coded flame graphs. Now, it even captures screenshots of every DOM update!
There are some great articles already written that will teach you everything there is to know about the React Profiler. The initial blog post does a great job of introducing most features, and Ekwuno Obinna’s article offers a real deep dive. I can also suggest watching Brian Vaughn’s recorded live stream, where he uses the React Profiler to locate and squash a few pesky performance bugs.
React DevTools is themable!
Are you one of those people that spend some time making your development environment look just right? Well, I have news for you! React DevTools is themable!
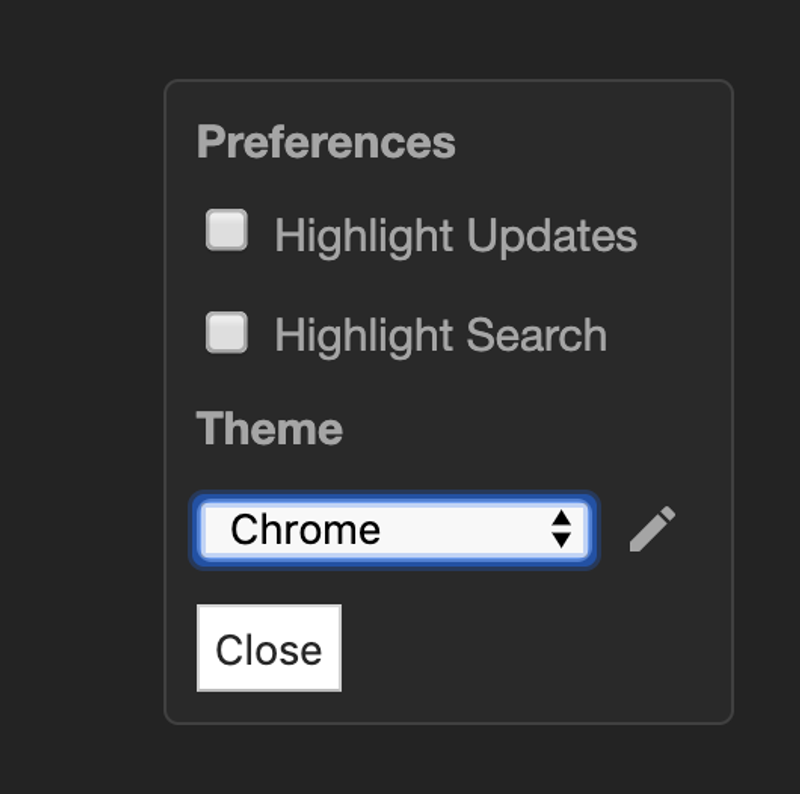
It follows your Chrome theme by default, so it’ll respect your dark mode preferences if applicable. But why stop there? The React DevTools comes pre-installed with 18 different themes, including some of the most popular themes for your favorite editors. If that’s not enough, there’s even a UI to implement your very own theme — right in the extension!
To start playing with themes, click the cog icon on the right side of the main panel. You’ll see a settings panel that lets you pick your pre-installed theme of choice.
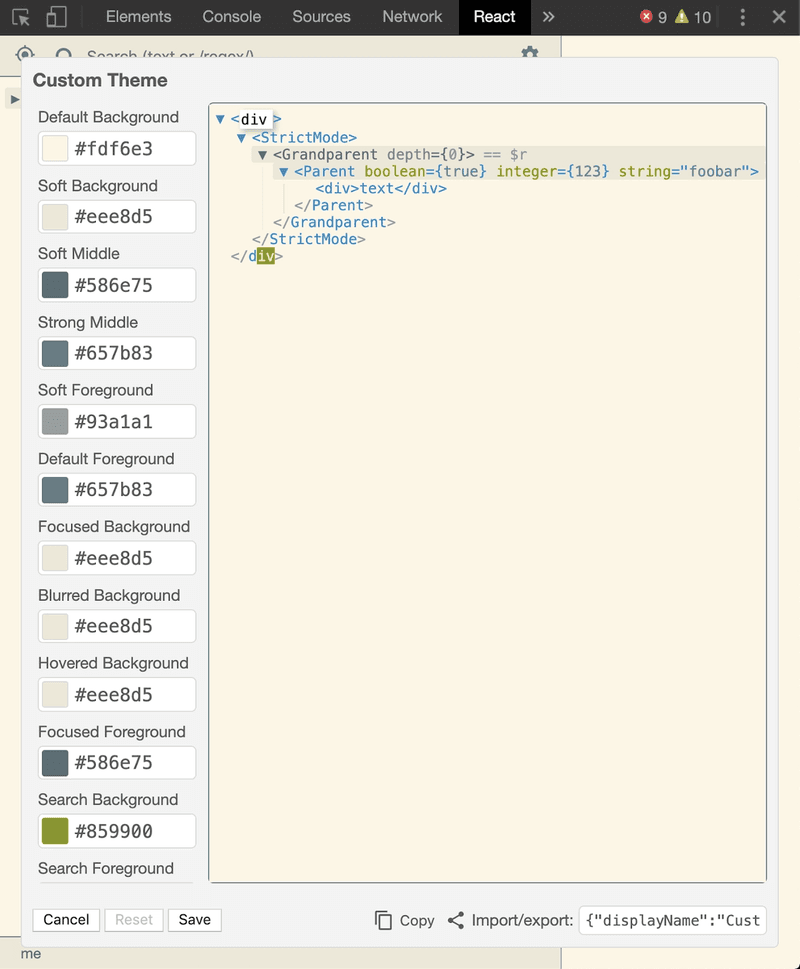
By clicking the pencil icon on the right of the dropdown, you’ll get access to the custom theme designer as well.
Interact in the console
Although you can find and fix most issues directly in the React DevTools, there are some debugging that just works better with a good ol’ console.log. One of my favorite features with the DevTools is that it actually gives you the option of interacting with the component instances via the console itself!
Select a component in the React DevTools, and pop open the console (hitting the escape key lets you see both at once). Type in $r, and you’ll have access to the instance of that component!
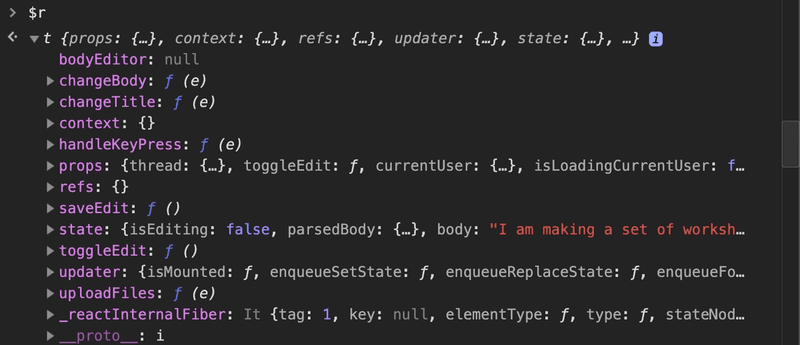
This gives you a lot of debugging power. You can trigger callback methods, inspect the state and even lets you augment functionality directly from the console. Pretty neat!
If you’re interested in a particular function (like a click handler or callback function), React DevTools also provide you with a nice little convenience-feature. If you right-click a function in the props or state overview, you get the option of making it available as a global variable! This way, you can call it whenever you want, with different arguments and contexts.
View source like a pro
The debugging tools in modern browsers are much more powerful than most people are aware of. You can set breakpoints, inspect state and props as your app changes, and step through code execution line by line. However, code compiled with Babel tend to be hard to read and a pain to follow. Wouldn’t it be great if there was a way we could actually view the source the way we wrote it?
Babel provides a plugin that adds a __source prop to all JSX elements, that lets the React DevTools link directly to the source code of the component you’re inspecting. It slows down your application a bit, but it works great in development mode.
To use this feature, install the babel-plugin-transform-react-jsx-source, apply it to your .babelrc file, and restart your dev server. When you right-click a component in the component tree now, you’ll see a new option — “Show <component name> source”.
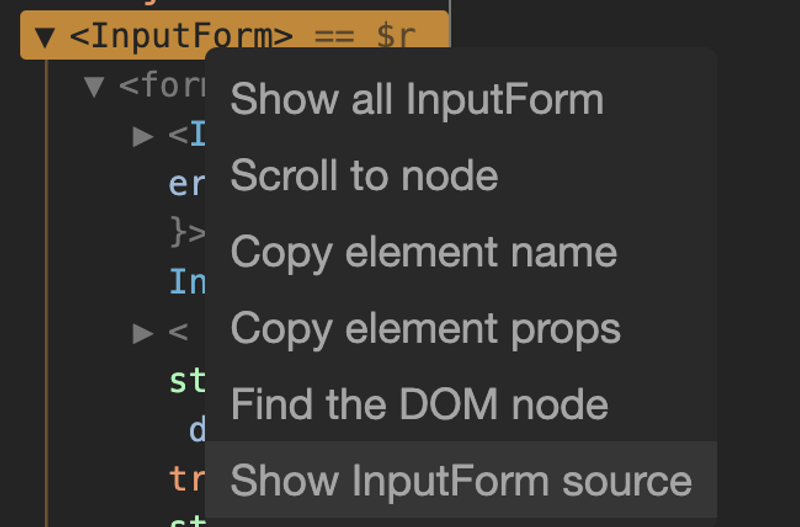
This lets you jump into the browser’s source view, where you can inspect, set breakpoints and alter the code altogether.
If you use the popular bootstrap-tool Create React App, you’ll find that this works out of the box. No config, no plugins, no nothing. Just jump straight to source!
Use secret React APIs
Did you know there’s a few top level exports from React that are made specifically for interacting with the React DevTools? You probably don’t need them very often, but they are incredibly nice to know about for when you do.
useDebugValue
When you’re creating custom hooks that are shared with other developers, it might be a good idea to use the useDebugValue hook. This hook adds an informative label to the hook that shows up in the React DevTools.
Interaction tracking
In some situations, understanding why a particular commit or re-render took longer can be a bit complicated. That’s why the React DevTools are introducing support for so-called interaction tracking. This is a programmatic API that lets you place labels on different events in your app, and trace their performance.
To get started, install the scheduler package, and import the unstable_trace method. This method accepts a label (“login button clicked”, for example), a timestamp and a callback. What happens in the callback will be traced at a much more detailed level than previously possible.
To learn more about this upcoming feature, please refer to Brian Vaughn’s gist on the subject. Please note that these features are still at a very early stage, and still under active development. They’re fun to play with, but the APIs might break at any point. Use with caution!
Profile in production!
If you’re experiencing a performance regression that’s only present in the production build of your application, you might want to try profiling your application. Unfortunately, React doesn’t include profiling support for the production build of React — by default.
Luckily, you can still opt into having profiling available in your production app. You might not want to ship it to your customers, but testing it out locally or in a QA environment will help you out quite a bit. To see how it’s done, check out this gist from Brian Vaughn.
The future of React DevTools
As previously mentioned, React DevTools is currently under heavy development. React Core team member Dan Abramov has spent the last couple of weeks helping out with shipping features, and a new major rewrite of the React DevTools is starting to take shape. Here’s a preview of some of the features we’re looking forward to the most:
Legacy React support
The current version of React DevTools only supports React 16 and up. In the new major release, however, supports React 0.13, 14 and 15 as well. This is great news for anyone stuck maintaining or bug fixing a legacy React codebase!
Collapsed or expanded tree view
When you open the React DevTools, you can now decide whether you want the tree view of your components to be collapsed or expanded by default. You can change your preference from the new and improved settings panel, found behind the cog icon.
Simplified tree view
The new version of React DevTools will get a slightly simplified tree view. No inline props will be shown (except the key, if applicable), and pure DOM nodes (like <div /> ) will be shown.
This is a pretty controversial change, and will probably receive a bit of blowback from the community once released. That being said, the plus side includes a lot better performance, as well as a more manageable tree-view UI.
Improved tooltips
Did you know React DevTools has pretty explanatory tooltips for most of its controls? Neither did most of the users. The native tooltips had a long delay, which led many users to assume there weren’t any tooltips at all. That’s why you’ll find new and improved tooltips in the upcoming version, courtesy of React Training-boss Ryan Florence and his Reach UI library!
Much, much more
The features listed above is just some of many that are expected to land in the new version of React DevTools. If you’re interested, you can read more about this new version in this Gist from Brian Vaughn.
Aside: About Brian Vaughn
As you might have noticed, Brian Vaughn’s name pops up a lot when we speak about the React DevTools. Brian works for Facebook, and is a React Core team member. He’s the main developer of the React DevTools, and has done a tremendous effort on creating helpful tooling for the average React developer. If you want to become a DevTools expert, I recommend you check out a few of his talks on the subject. Brian has also done a few podcast interviews that are worth checking out.
An incredibly important tool
The React DevTools have made it a lot easier to build, ship and debug React applications than ever before. Thanks to the new Profiler API, we can even squash most performance hiccups in no time! It’s an incredibly important tool to learn how to use and master, for novices and pros alike.